 The Breathe London project has this week released a 3D data visualisation story created by the Environmental Defense Fund Europe and Google.
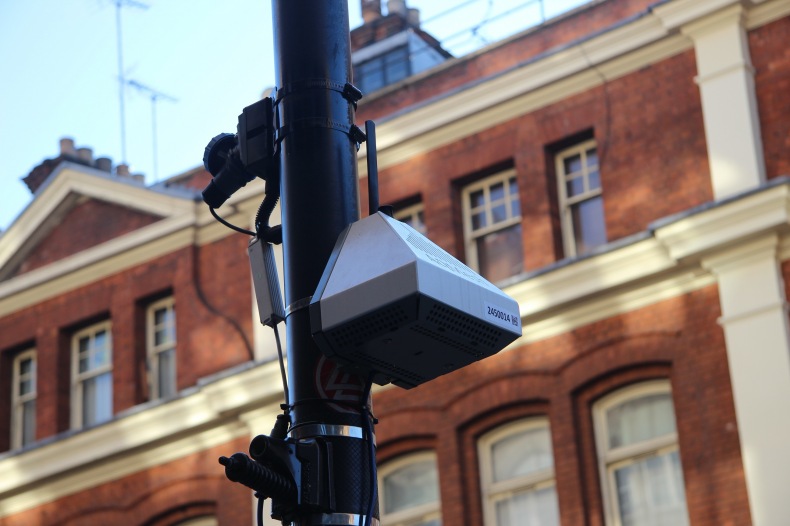
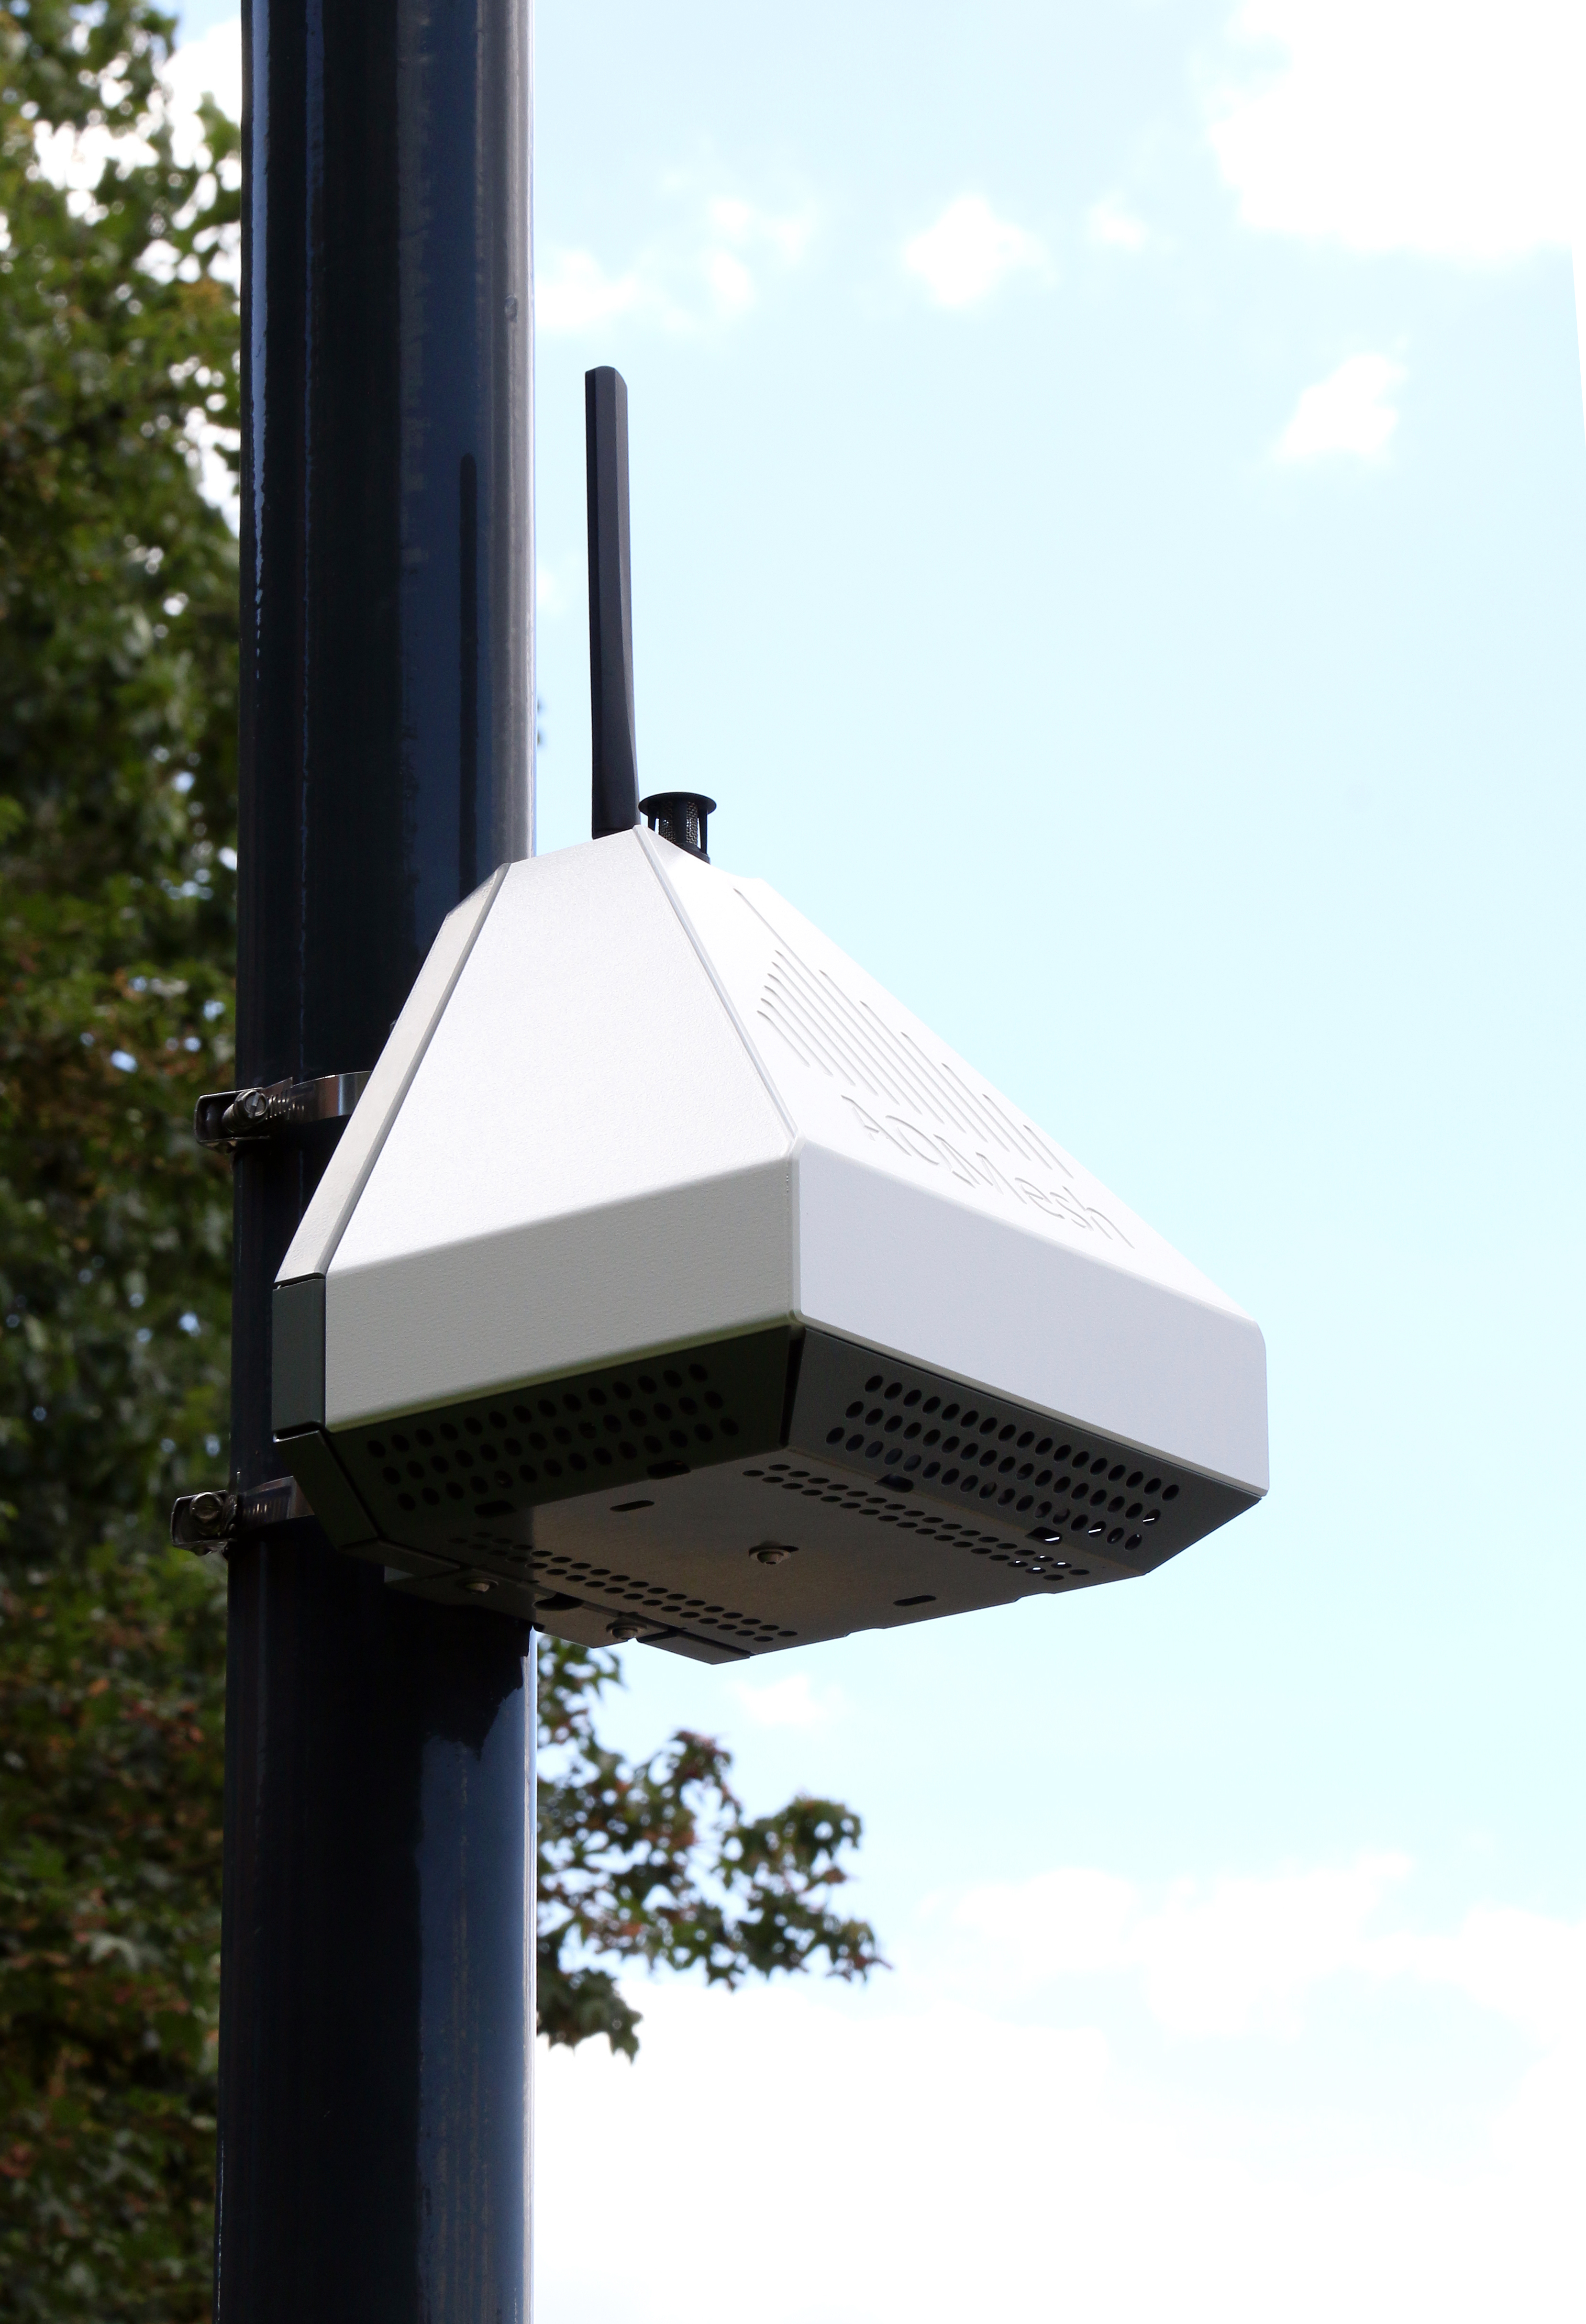
Between Autumn 2018 and 2019, Google Street View cars were fitted with mobile sensors in order to drive around London and take readings of nitrogen dioxide (NO2) levels every second, to supplement the city-wide air quality monitoring network of 100 AQMesh pods.
Preliminary analysis of the pollution data gathered by the Google Street View cars found that, on average, levels of NO2 were 50% higher on major routes like Kennington Park Road, than quieter areas, like Alberta Street, which is only one street over.
The pollution data can now be explored on a 3D map of London via Google Earth.
NO2 is one of London’s most prevalent pollutants, and exposure to it can lead to harmful respiratory problems and impact on children’s lung development, which is why Breathe London was launched to give residents better information on local air pollution and its effect on human health.
The network of AQMesh pods and specially-equipped Google Street View cars was deployed in 2018 and a live map of pollution data across the city has been available to the public since July 2019.
So far, air pollution across the capital has been high. In November, it was reported that four out of every five AQMesh pods were recording levels of fine particulate matter (PM2.5) that exceed World Health Organisation (WHO) annual guidelines. Unsurprisingly, during the national lockdown over April due to Covid-19 crisis, data from the project showed significant reduction of pollution levels across the city, including an average drop of 24% in NO2 across the entire Greater London AQMesh network.
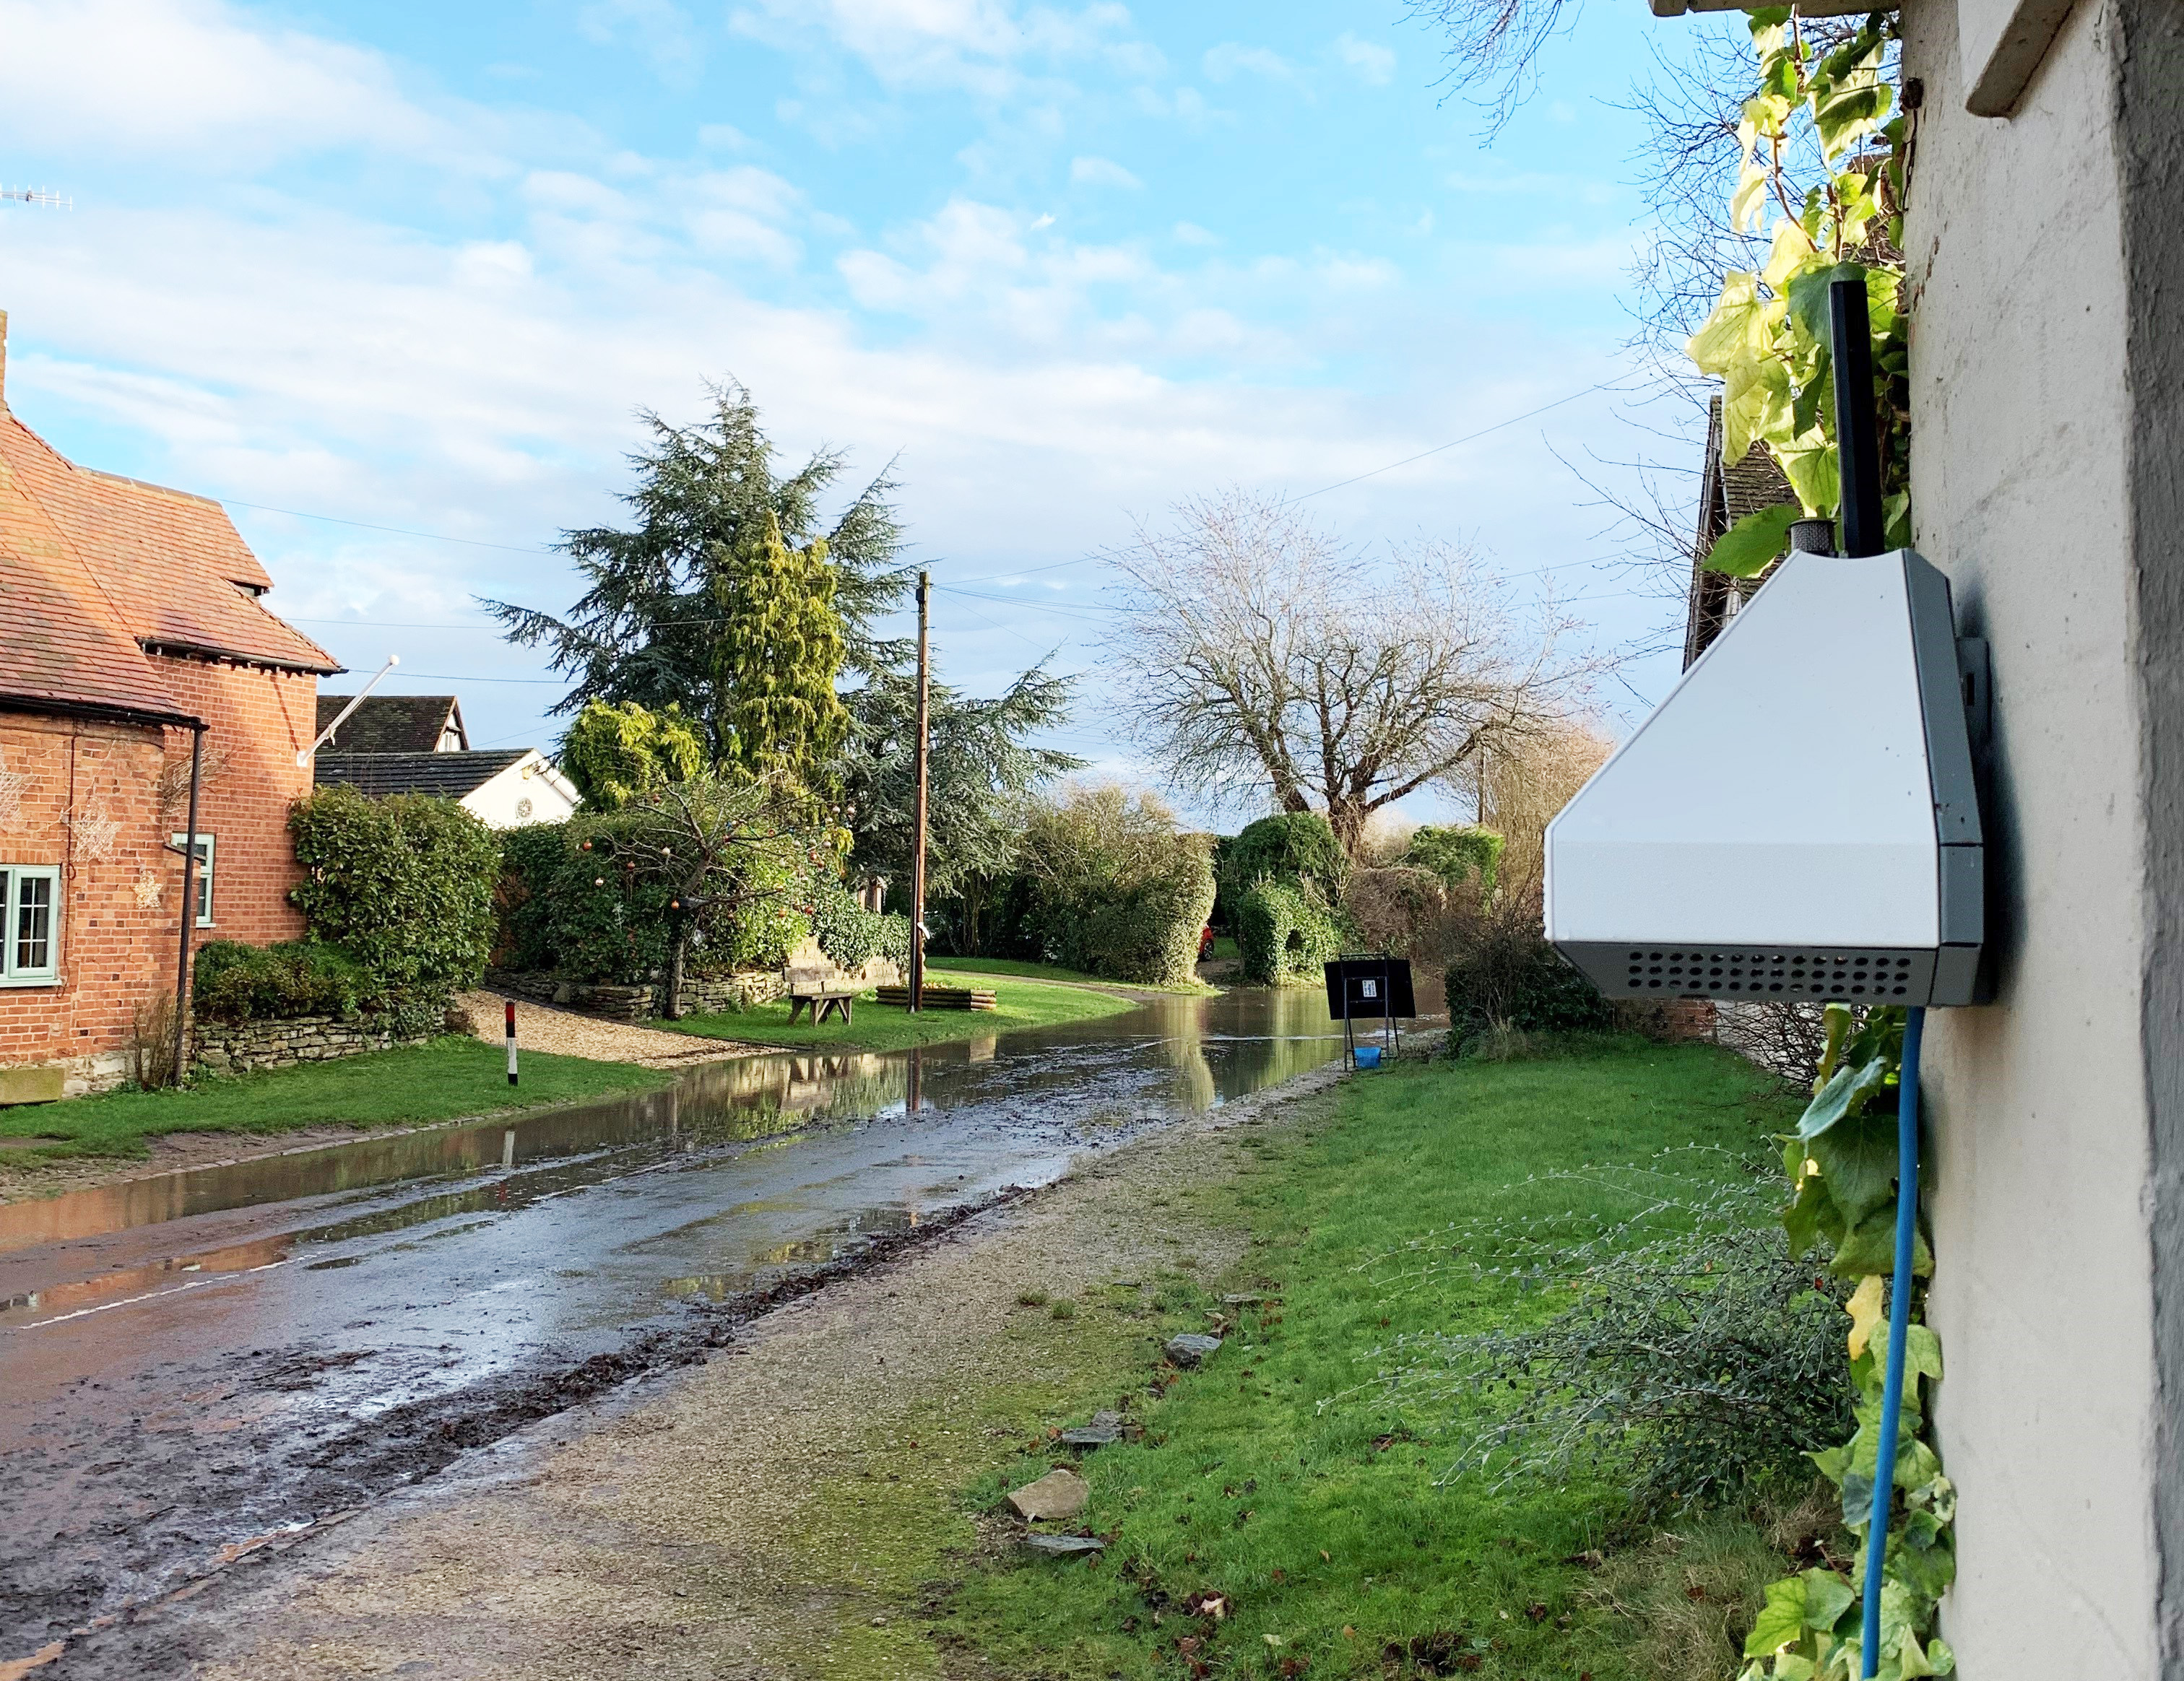
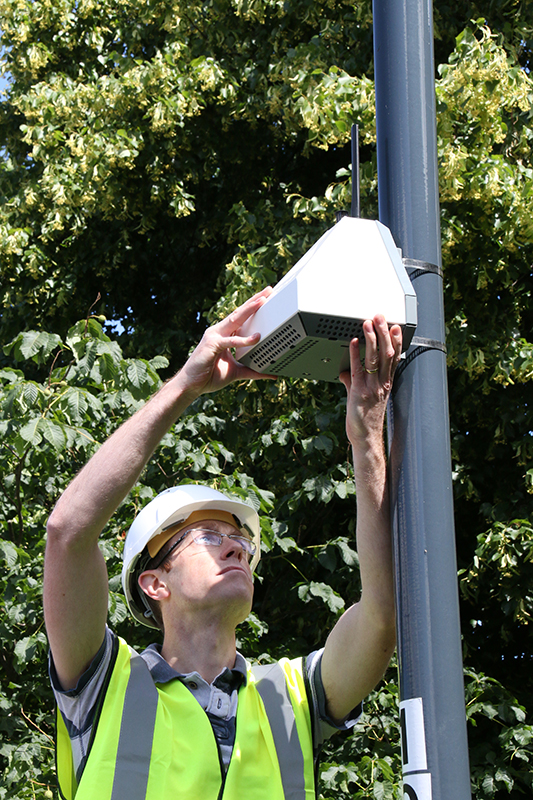
AQMesh pods are small-sensor air quality monitoring systems offering real-time localised air quality information and data analysis. Varying sizes of networks of AQMesh pods are currently deployed worldwide in a number of smart city initiatives, including Breathe London in the UK.
-----
Read more AQMesh case studies & news.
View AQMesh product information.
More about Breathe London:-
EDF Breathe London blueprint for smart cities


