Research shows that increasing the number of measurement points improves the spatial resolution of urban air quality models.
At the RSC AAMG event on ‘Air Quality Monitoring: Evolving Issues and New Technologies’ Professor Rod Jones of the University of Cambridge presented a paper showing very encouraging results. “Because we know that all the pods read the same and because we have a comparison between one pod and a reference instrument we can say that all pods are working equivalently across the city. What we are seeing is correspondences in excess of 0.7, 0.8, against reference and that is very good for straight out of the box”, commented Professor Jones.
These findings are from a project in Cambridge where 20 pods, initially co-located at the AQMesh UK factory, were placed at key points around Cambridge. The objective was to demonstrate what could be shown about ambient air quality at key points in the city, using a larger number of measurement nodes to understand how air quality varies across the city, particularly in relation to key transport corridors and areas of construction activity.
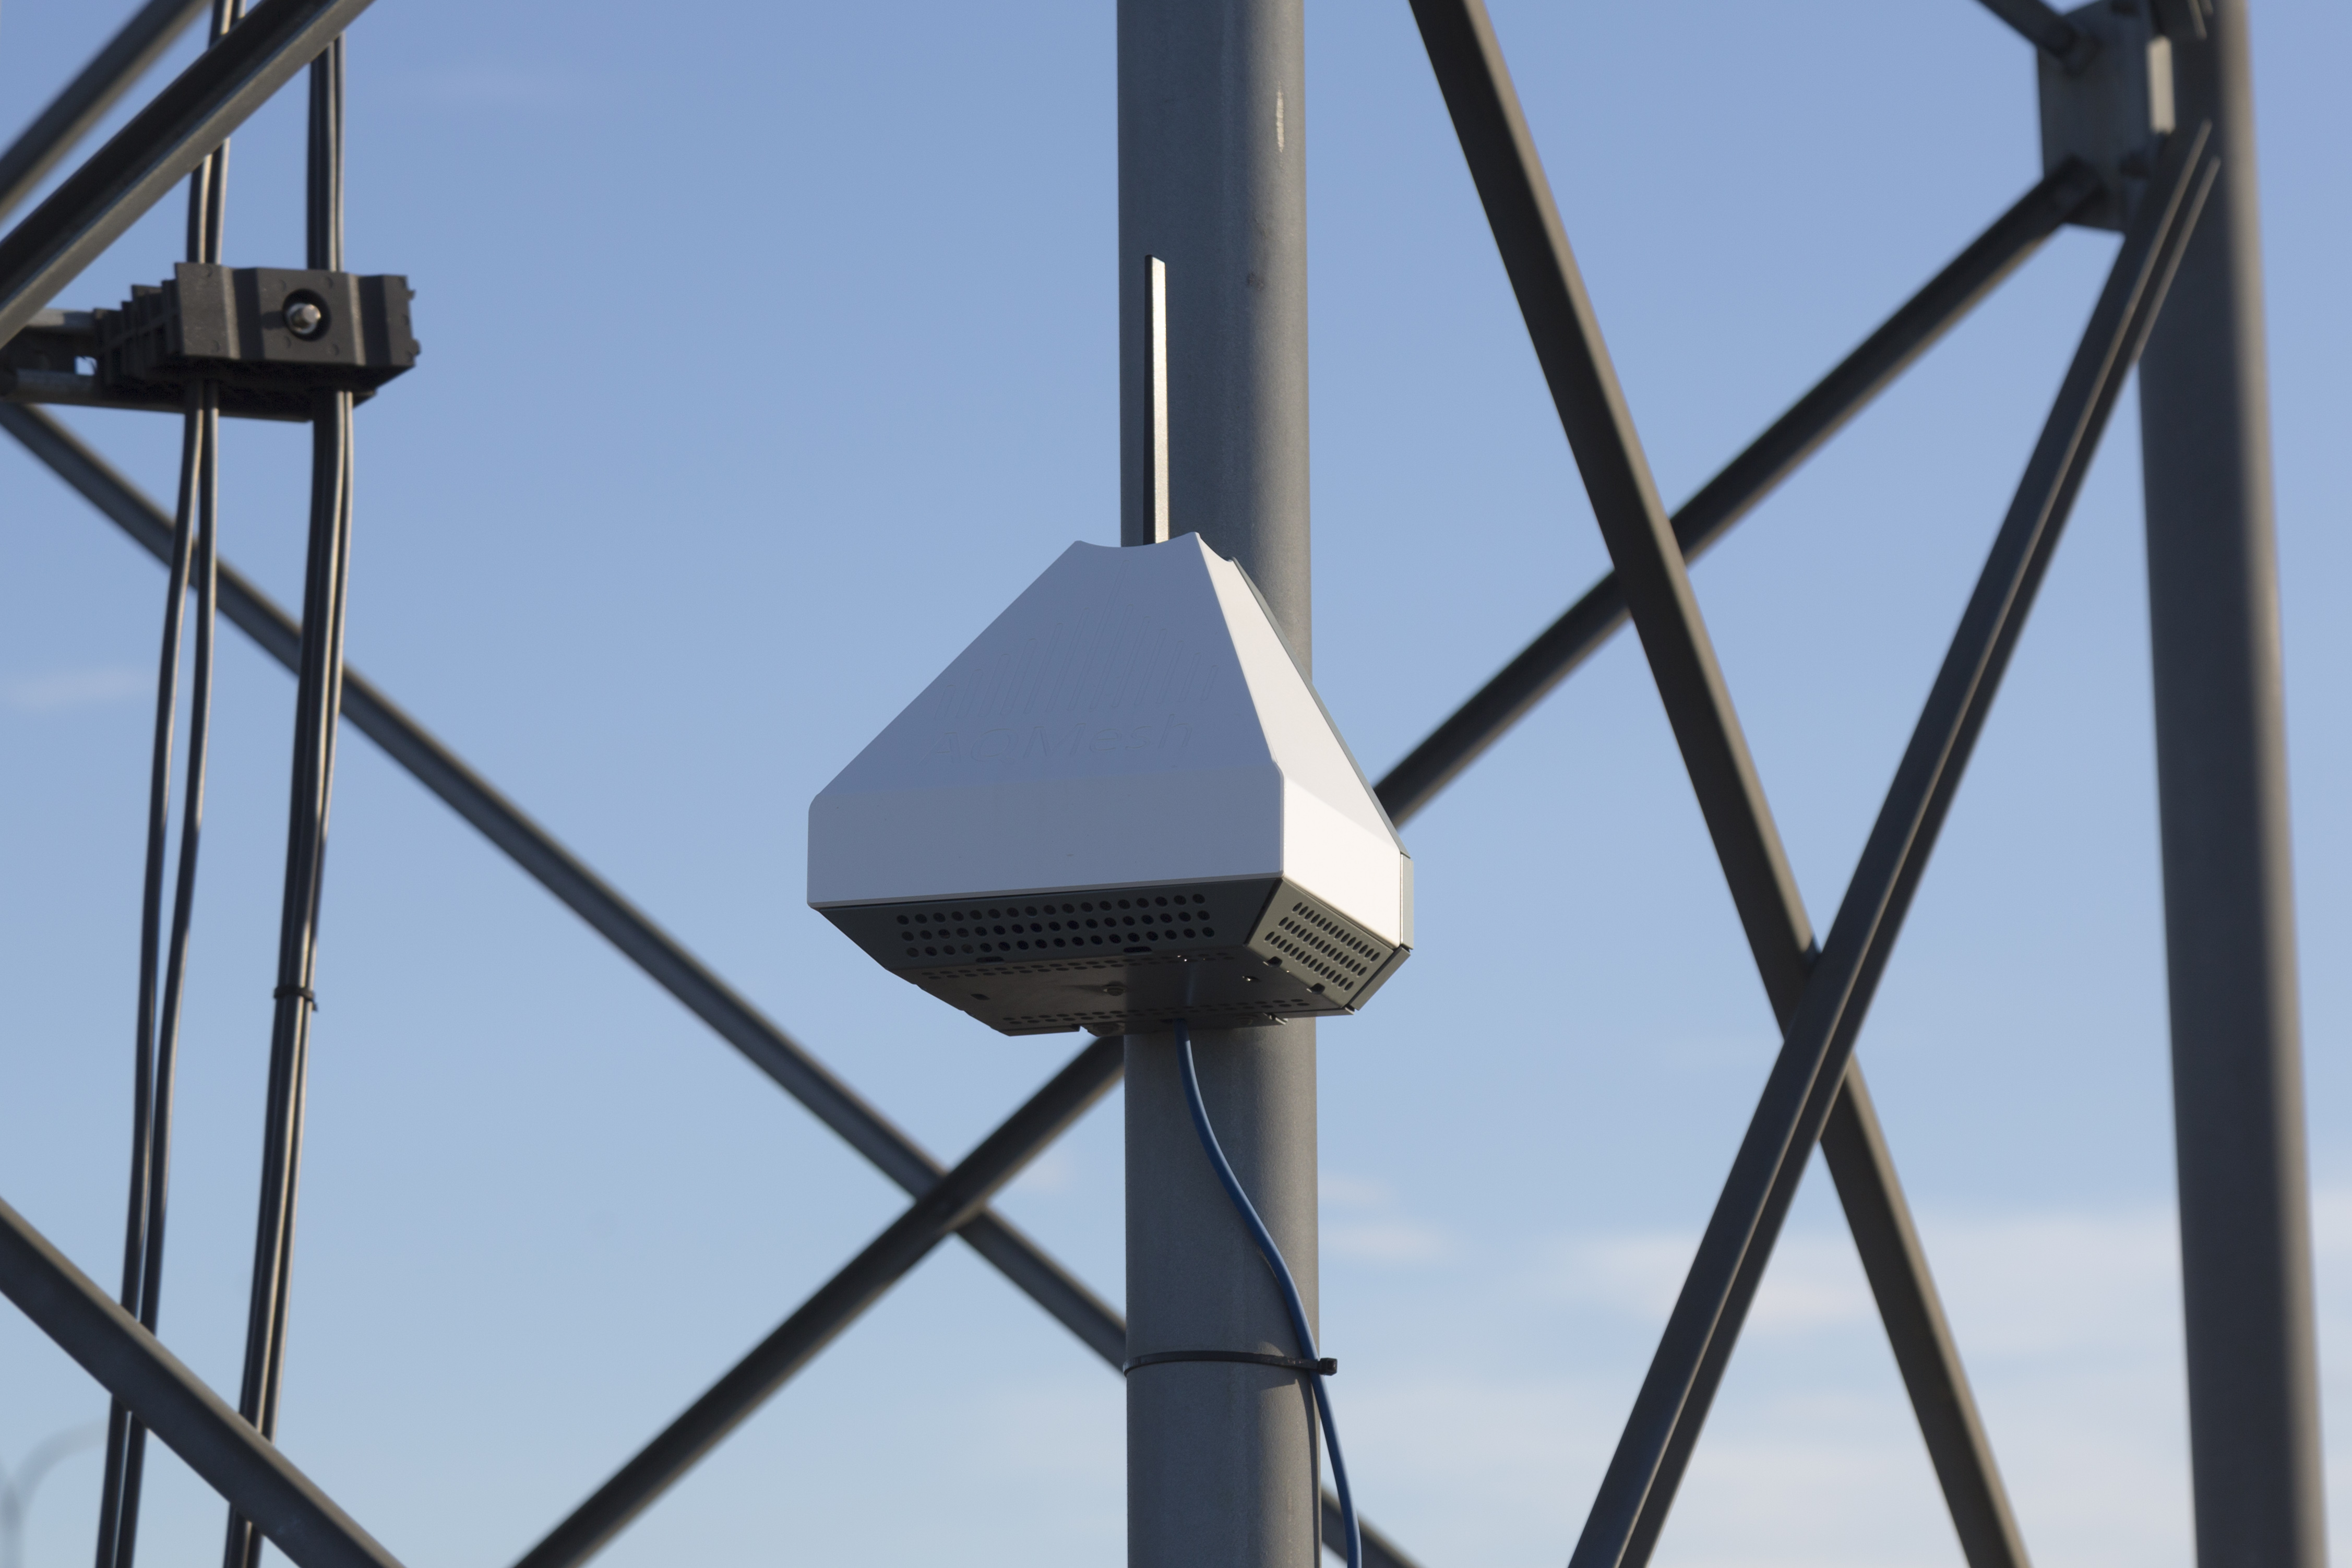
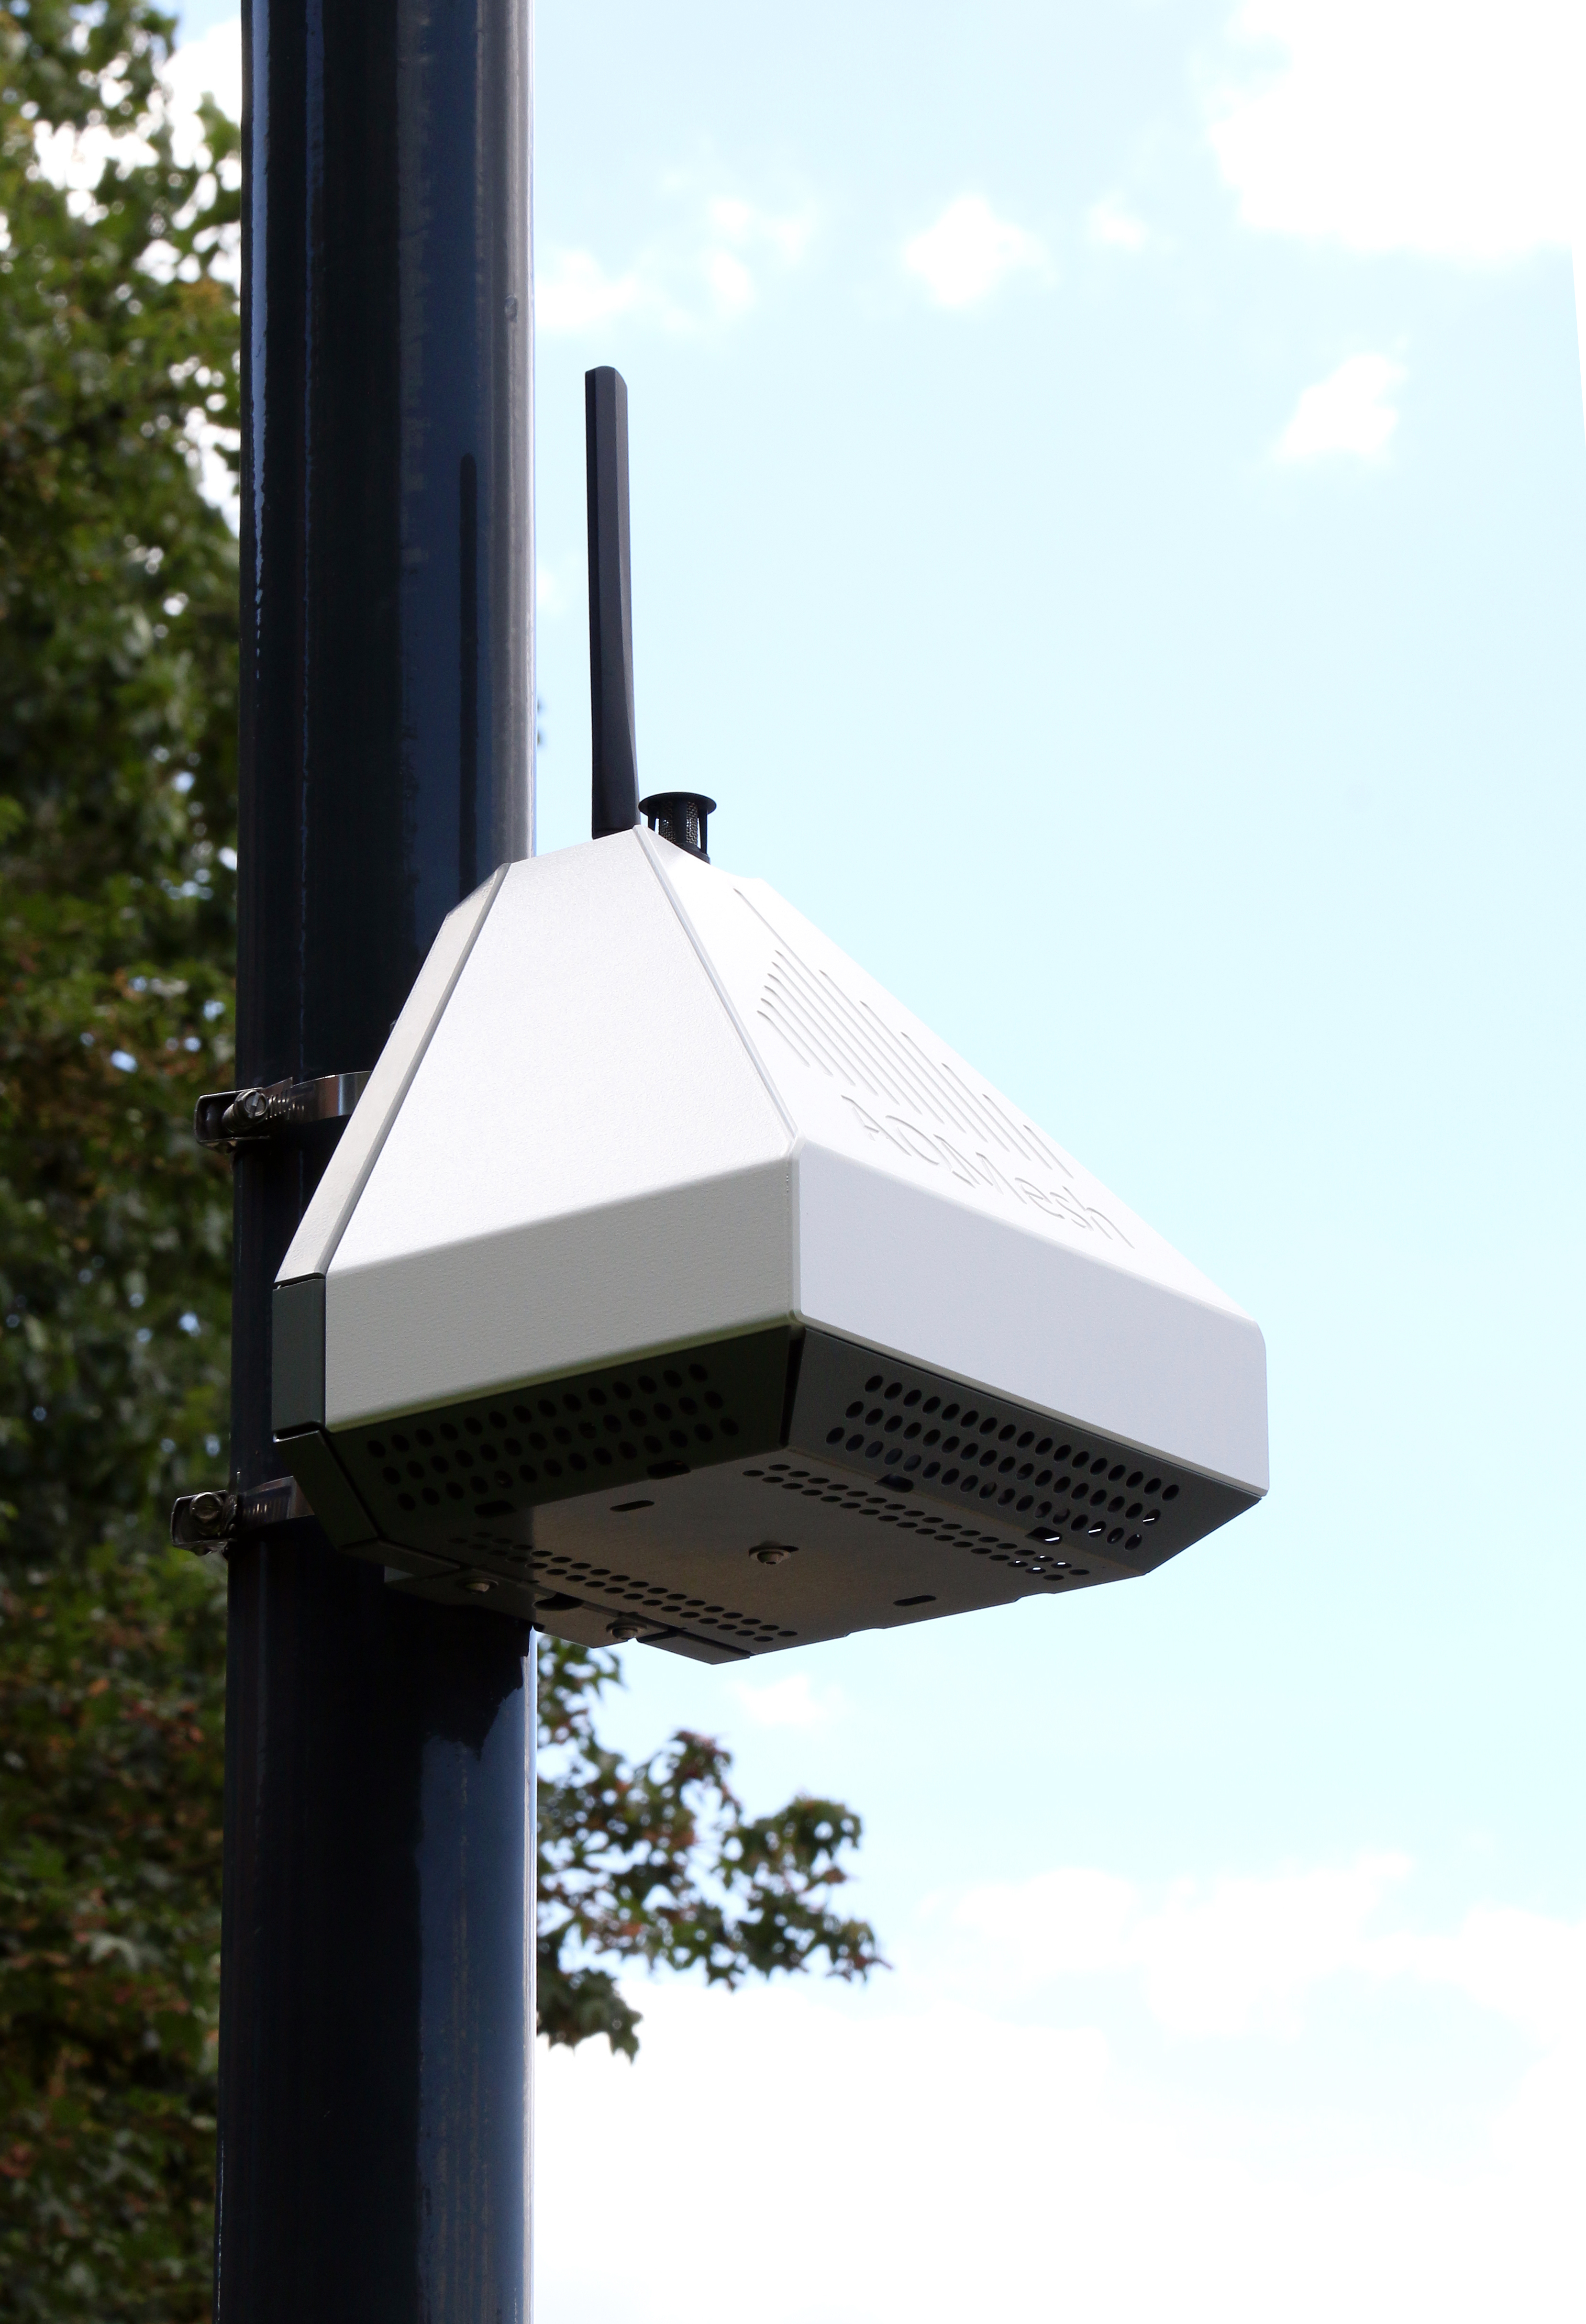
The 20 AQMesh pods measure gases (NO, NO2, O3, CO and SO2, particulate matter (PM1, PM2.5 and PM10) and environmental conditions (atmospheric pressure, relative humidity and pod temperature). 19 of the pods are powered by lithium battery and have been gathering data at 15 minute reading averages since June 2016, without any need to visit the sites to change batteries or carry out maintenance. The twentieth pod is currently running at one minute reading intervals, mounted at a Cambridge City Centre reference station, using a high capacity lithium battery. Each pod is small enough to be easily mounted to a post, wall or enclosure and all pods have been functioning without fault throughout the project.
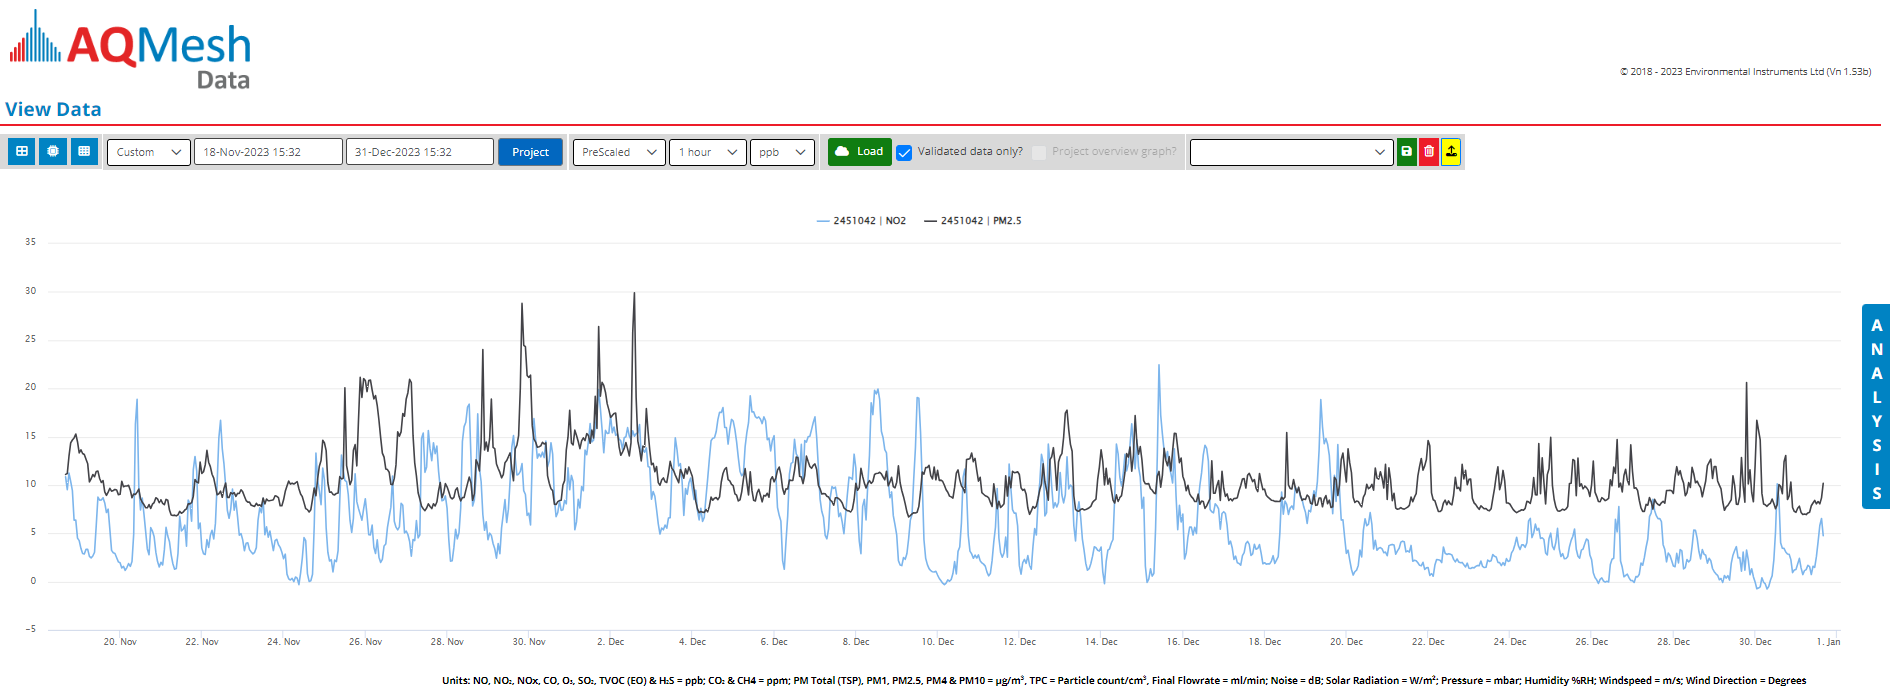
As part of the project, data has also been pushed directly from the AQMesh server to a University of Cambridge server where it is automatically displayed in near real time. A further aspect of this initial project is to compare collected AQMesh data with ADMS-Urban modelled data for the same area and then use the real-time AQMesh data to improve the airTEXT air quality forecasts for Cambridge.
The next steps are to calibrate the pods and to analyse the data in more detail. Co-locating one of the pods with the reference station has allowed slope and offset values to be calculated, as all pods had already been co-located, allowing the same scaling to be applied to all pods. These values can then be applied to the AQMesh server, improving the accuracy of all data gathered after that point. Initial analysis using wind rose plots has shown the extent to which pollution can be attributed to local road traffic at each point. Further analysis of data will show how pollution varies across the locations and by time of day or week.


